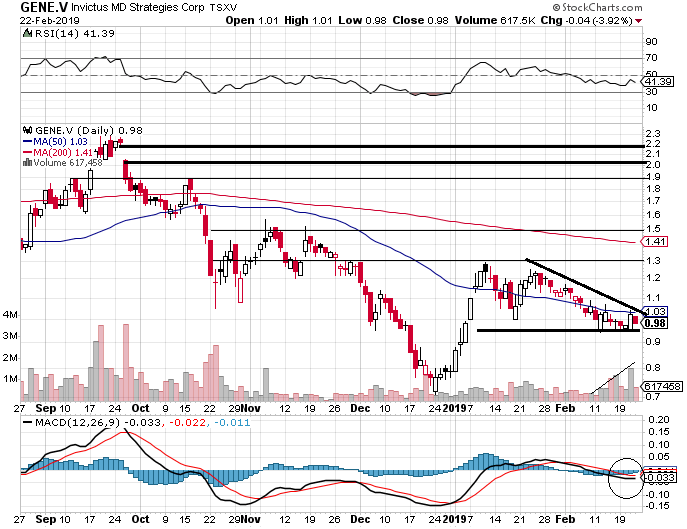
Looking on the weekly chart we are putting in a large descending triangle and currently testing its trend line resistance. Price action pinching between the 100sma (support) and the 50sma (resistance), and starting to see increasing volume with the MACD just starting to make its cross. RSI still on its upward movement, we will be watching for either a test of support between $2.65 – $2.50 if the 100sma breaks down.


Symbol: GENE.v
Market Outlook: We are expecting Emerald Health Therapeutics to test its 21sma support at $3.60 on the daily chart which is also short term support on the weekly.
Support: $3.60
- 21sma – $3.60 (Daily)
- 100sma – $3.54 (Daily)
- 100sma – $3.30 (Key long term support, Weekly)
Resistance: $4.27
- Upper BB – $4.75
- Key Resistance – $4.85 (Weekly)
Technicals: MACD made its cross on the weekly chart and trying to push above 0, Money Flow Index (MFI) in an upward trend and seeing increasing volume with a test of the descending wedge trend line resistance.
Sentiment: Neutral


