– Knowing When To Enter –
Spotting a decent trade takes time and experience, learning the indicators and
fundamentals of a good play before it happens keeps you from entering in the FOMO
(Fear Of Missing Out) phase and potentially losing a lot of money.
In this article iʼm going to focus on a few chart setups that i like to use to determine a
good entry point. Now that we have touched on the basics of good habits to keep,
determining your position size and risk reward ratio, we are going to look at knowing
when to enter. The reason iʼve decided to share these entry indicators is because they
are of high probability youʼre going to have a profitable risk/reward ratio. A few things to
be aware of when looking for potential trading opportunities is what price warrants,
private placements (PP) and employee stock options are exercised and when they
expire. Look for these offerings as they will indicate possible support and/or resistance
levels that you will not see on the chart. Look for warrants, stock options and PPʼs
expire dates because when the news gets released the stock will most likely see
increasing volume, as its notifying you the end of dilution for that round.
-Bottom / 52 Week Lows-
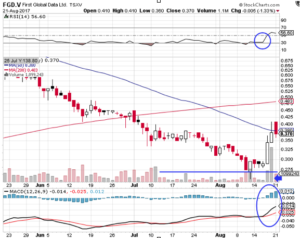
Bottom/ 52 Week low plays were some of my favorite plays when i was first starting to
learn how to trade, mainly because majority of the time they have been oversold just
like you see here on FGD.V. The RSI was trading under 30 which indicates the stock
has been oversold. Notice the bullish candle holding the blue line accompanied by good
volume, we see a slight re-test of the blue line then very bullish price action with
increasing volume and the MACD forking. The RSI comes out of oversold territory and
the stock takes off. One of the first things i would look for with this play is the increasing volume.

-Channel Breaks-
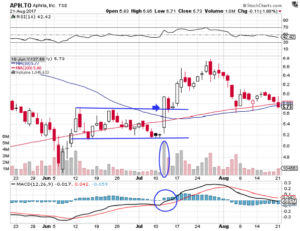
Channel plays are great way to keep your risk/reward strategy in check, when a stock is
trading in a channel like APH.TO its referred to as “ranging”. These patterns are great
for having low risk and high reward because youʼre able to easily spot support and
resistance and set a well defined stop loss just outside of your support line. Obviously
the best place to enter this play is at the bottom of the channel. Watch for support to
hold and your indicators to show bullish signs. Here we see it bounce off support with
very high volume and a MACD fork with an increasing histogram. It breaks out of its
channel and turns its previous resistance into support and holds. This is how you know this bullish move is strong and has more strength to run higher.

-Flag/Pennant Breakouts-
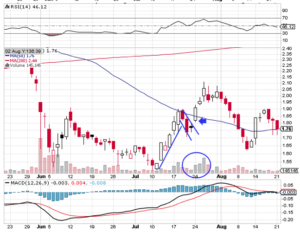
Flags and Pennants are some of the most used day trading patterns out there, mainly because of their high success rate. Pennants and flags hit their average rise targets
%50-%90 of the time and the trend after the pattern is usually as large as the trend
leading to the pattern. Looking at EMC.V we see a nice bull run (the pole) followed by
consolidation (the flag) at the tip of the flag youʼll see a doji, this is an indication of
market indecision meaning its a possible point of reversal/ breakout of the bull flag. At
the doji you will see the beginning of the volume increasing and turning bullish. The next
day the price gaps up and breaks out of the bull flag and from the tip of the flag you can
see that the run is almost a the size of the previous run before the flag pole started.

-Gap Fills-
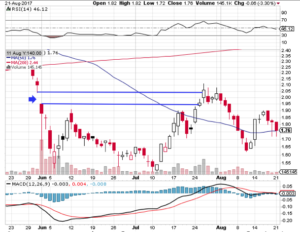
There are 4 different types of gaps and they all have their own unique meaning and trend distinction. This is the list of the different gaps, and in this example i will be
referring to the generalization of gaps to keep it simple. You have the area gap,
exhaustion gap, breakaway gap, and continuation gap. Whichever gap you are
looking at statistics show gaps fill upwards of %90 of the time. There is no specific time
frame on when they will fill but its been noticed that it takes anywhere from 1 day to
months for a gap to fill. There is thought that thereʼs institutional incentive for gaps to
close which is one of the hypothesisʼ gaps close at a rate of %90. Below you can see
EMC.V was in a strong downtrend when this breakaway gap happened, youʼll notice the
bottom of the wick from the previous day and the top of the body from the next trading
day there is a gap between price action, that is called a gap. Knowing a good entry
point is a bit more advanced when playing gaps so what i like to look for is consolidation
and a confirmed base before entering to play a gap. You can see around July 10th the
stock makes a double bottom before it makes its way to close the gap. You need to
confirm the stock is holding itʼs current level before entering to play a gap.

Learning these types of chart setups will ensure you have a high success rate in
trading. Having good entries and exits is imperative to staying alive in the trading world,
by reducing your risk and playing high probability trades it will give you the edge above the %90 of traders that fail.


I found nice posts here. I like the way you write. Nice!